
Note 04 · Rain chance · experimental
Will it rain in the next hour?
Inside US radar coverage, the experimental rain-chance layer was close to honest for moderate rain; worldwide, for light rain, it is still too confident.
A summary of internal testing. Methods are described only in outline. Not an official forecast or warning.
- 0.58skill for 1 mm or more inside US radar (0 = no skill, 1 = perfect)277,307 cells, 18 start times, 20–22 Nov 2026
- 0.38the same against airport rain gauges6,564 station-hours
- 0.14 vs 0.0650-member ECMWF ensemble against the previous version of the layer, 1 mm, worldwide993,600 pairs, 23 hours
- −0.26for any rain (0.1 mm) worldwide: too confidentbelow zero = worse than climatology
What the layer shows
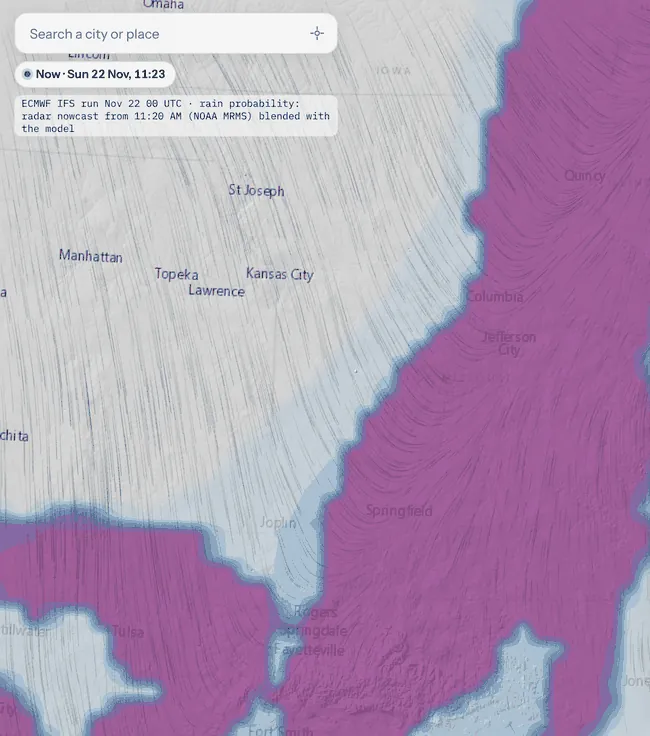
“Rain probability, next hour” shows, for each place, the chance that at least 0.1, 1 or 5 mm of rain or melted snow falls in the next 60 minutes, in 10 % steps. Inside radar coverage it combines the radar nowcast with the forecast; elsewhere it uses the forecast alone, normally built from the 50 members of the ECMWF ensemble. The legend says which source is in use. The layer is labelled experimental automatic guidance, not a warning.
What “70 %” should mean
A chance forecast is reliable when it means what it says: of all the times it shows 30 %, rain should follow about three times in ten. A reliability chart plots the chance shown against how often rain actually followed. Points on the diagonal are honest; points below it are over-confident.
Reliability: forecast chance against how often rain followed
Chart in words
Left: the layer as shown against the US radar-and-gauge estimate, 18 start times, 277,307 cells: points lie close to the diagonal (for example 70–80 % was followed by rain 73 % of the time). Right: the model part worldwide against the NASA IMERG satellite estimate, 23 hours, 993,600 pairs: points lie far below the diagonal (84 % was followed by rain 36 % of the time).
Against radar and rain gauges
For 18 start times between 20 and 22 November 2026, inside US radar coverage, we compared the layer as shown with NOAA’s one-hour radar estimate adjusted to rain gauges (277,307 grid cells). The score is the Brier skill score: 0 means no better than always forecasting the usual frequency of rain, 1 is perfect. For 1 mm or more, the layer reached 0.58, and when it showed 70–80 %, at least 1 mm fell 73 % of the time. Against 6,564 hours of automated airport rain gauges, the skill was lower but the ranking the same: 0.38 at 1 mm.
Skill inside US radar coverage, by part
Chart in words
Brier skill score against the following hour of US radar-and-gauge estimates, 18 start times, 20–22 November 2026. 0.1 mm: radar 0.61, model 0.25, combined 0.58. 1 mm: 0.57, 0.31, 0.58. 5 mm: 0.00, 0.02, 0.16 with a wide uncertainty that includes no skill.
The 50-member ensemble
Outside radar coverage, the chance comes from the forecast. ECMWF runs its model 50 times with slightly different starting conditions; the share of runs that bring rain is a natural chance. We compared this with the previous version of the layer, against NASA’s IMERG satellite rain estimate between 60° S and 60° N (23 hours on 20–21 November 2026, 993,600 pairs per threshold). The 50-member ensemble won at every threshold, mostly because its percentages are more honest. Extended to 33 hours and 1.43 million pairs, it won in every region we split out, most in the tropics and over the sea.
The 50-member ensemble against the previous version, worldwide
Chart in words
Brier skill score against the NASA IMERG Early satellite estimate, 60° S–60° N, 23 hours on 20–21 November 2026, 993,600 pairs per threshold. 0.1 mm: previous version −0.37, ensemble −0.26 (both worse than always forecasting the usual frequency). 1 mm: 0.06 and 0.14. 5 mm: 0.01 and 0.03.
Where it is too confident
For any rain at all (0.1 mm), the worldwide chance is too high: when the forecast part said 84 %, the satellite saw rain only 36 % of the time, and the score is below zero. Part of the gap may be the reference itself, because satellite estimates miss light rain and drizzle; we cannot yet separate the two. Inside radar coverage, the rain chance tends to be all-or-nothing, showing few in-between values. The percentages are not yet calibrated, and the legend says so.
Data and attribution
Forecast data: ECMWF open data (IFS and ENS), CC BY 4.0. Radar and gauge-adjusted estimates: NOAA MRMS. Satellite rain: NASA IMERG Early via NASA GIBS. Rain gauges: airport reports via the NOAA Aviation Weather Center.
A summary of internal testing. Methods are described only in outline. Not an official forecast or warning.