
Note 03 · Radar nowcast
Rain in the next two hours
On 30 real US radar cases, Marble’s nowcast placed rain better than assuming nothing moves at every step out to two hours; one hour ahead it scored 0.47 against 0.31.
A summary of internal testing. Methods are described only in outline. Not an official forecast or warning.
- 30real cases on 15 days, January–November 2026about 17 independent situations
- 0.47rain placement score one hour ahead (“no change”: 0.31)rain of 1 mm/h or more
- 0.38score two hours ahead (“no change”: 0.20)rain of 1 mm/h or more
- < 0.15best score for heavy rain (10 mm/h) beyond one hourheavy cells are hard
What the radar layer shows
Over the contiguous United States, Marble draws rain from NOAA’s Multi-Radar Multi-Sensor (MRMS) radar mosaic. A slider runs from 50 minutes ago to two hours ahead; beyond the latest scan, the nowcast carries the rain forward along its recent track. The label under the slider gives the time, the source and the mean motion. Outside the United States, the layer uses RainViewer imagery with approximate intensities.
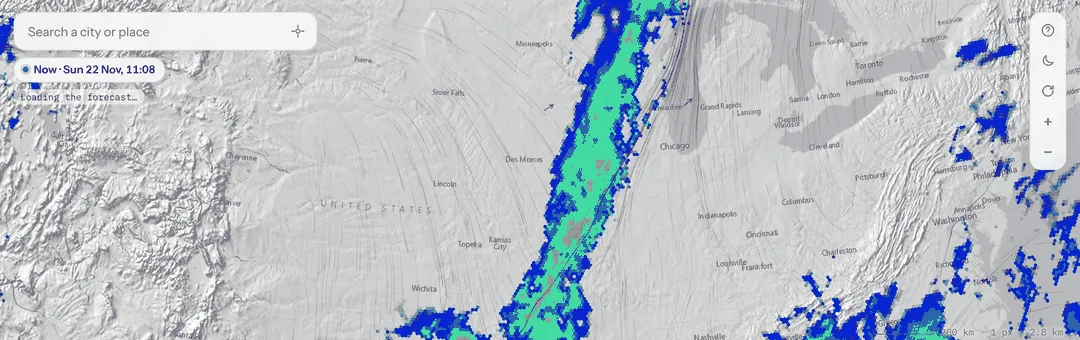 Latest scan
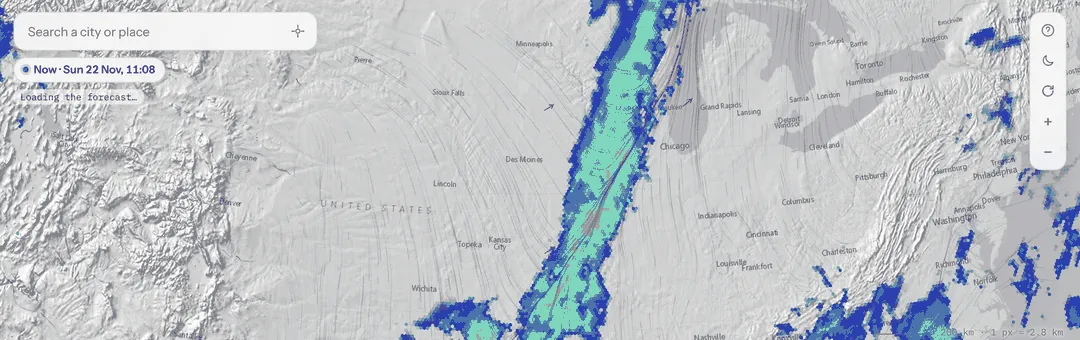 Nowcast, +60 min
How we tested it
We picked 30 start times on 15 days: one every two hours from 20 to 22 November 2026, and the wettest hour of 12 earlier days between January and November, so that winter storms and summer thunderstorms are included. Each time we took the wettest radar window over the United States, ran the same nowcast the layer shows, and compared it with the radar scans that actually followed, every 10 minutes for two hours.
The score is the critical success index, a standard measure for rain areas: of all the places where rain was forecast or observed, the share where both agree. 1 is perfect, 0 is no overlap. The baseline is no change: freezing the latest scan, which is surprisingly hard to beat in the first minutes.
Rain placement score by minutes ahead
Chart in words
Critical success index for rain of at least 1 mm per hour, pooled over 30 cases. Marble nowcast: 0.72 at 10 min, 0.57 at 30, 0.47 at 60, 0.42 at 90, 0.38 at 120. No change: 0.60, 0.42, 0.31, 0.25, 0.20.
What we found
At 10 minutes the nowcast scored 0.72 against 0.60, at one hour 0.47 against 0.31, and at two hours 0.38 against 0.20. The nowcast also had the smallest error in rain intensity of the forecasts we compared.
One hour ahead, by rain intensity
Chart in words
Critical success index at 60 minutes. At least 0.5 mm/h: no change 0.38, Marble 0.54. At least 1 mm/h: 0.31 and 0.47. At least 5 mm/h: 0.12 and 0.23. At least 10 mm/h: 0.06 and 0.13.
Heavier rain is harder. For 5 mm/h the score at one hour was 0.23, and for 10 mm/h no forecast exceeded 0.15 after an hour. At two hours the nowcast also softens the heaviest cores: it shows only about 60 % of the area of rain above 10 mm/h. Summer thunderstorms were harder than autumn and winter fronts, because cells grow and decay faster than they move.
Data and attribution
Radar: NOAA MRMS via the NOAA Open Data Dissemination program; RainViewer outside the US.
A summary of internal testing. Methods are described only in outline. Not an official forecast or warning.