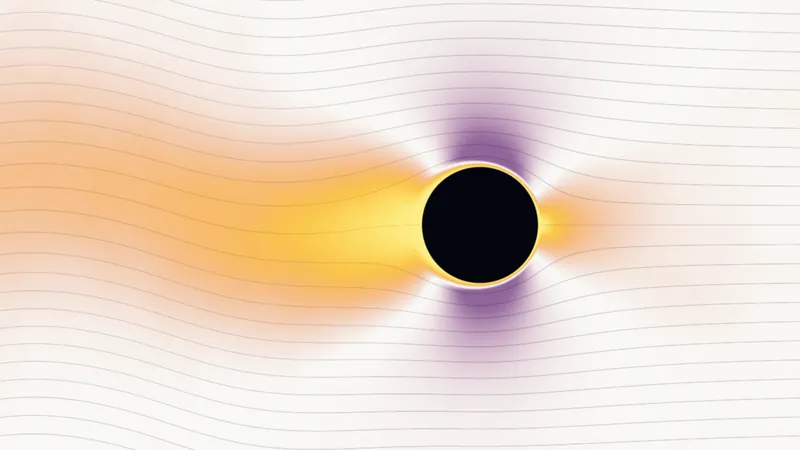
Adjusting the forecast to the real height of the ground more than halved the typical temperature error in deep valleys, changed nothing on flat ground, and still leaves high summits too cold at night.
November 20264 min readSuperlumine
A summary of internal testing. Methods are described only in outline. Not an official forecast or warning.
6.5 → 3.0 °Ctypical error at stations more than 750 m below the model’s ground410 comparisons, 95 stations
1.75 → 1.73 °Con flat ground: no measurable change46,218 comparisons
2.2 °Ctoo cold on summits at night, on average630 comparisons, 87 stations
63,089comparisons at 8,932 stations17–22 Nov 2026
Why mountains fool a global model
A global model divides the planet into squares about 28 km wide, so it sees mountains as smooth, rounded hills. Along the line across the Alps shown below, the model’s ground reaches 2.9 km where the real summits rise above 4 km, and valley floors lie below 700 m. Air usually gets colder with height, so a town in a deep valley is warmer than the model’s smoothed ground suggests, and a summit is colder.
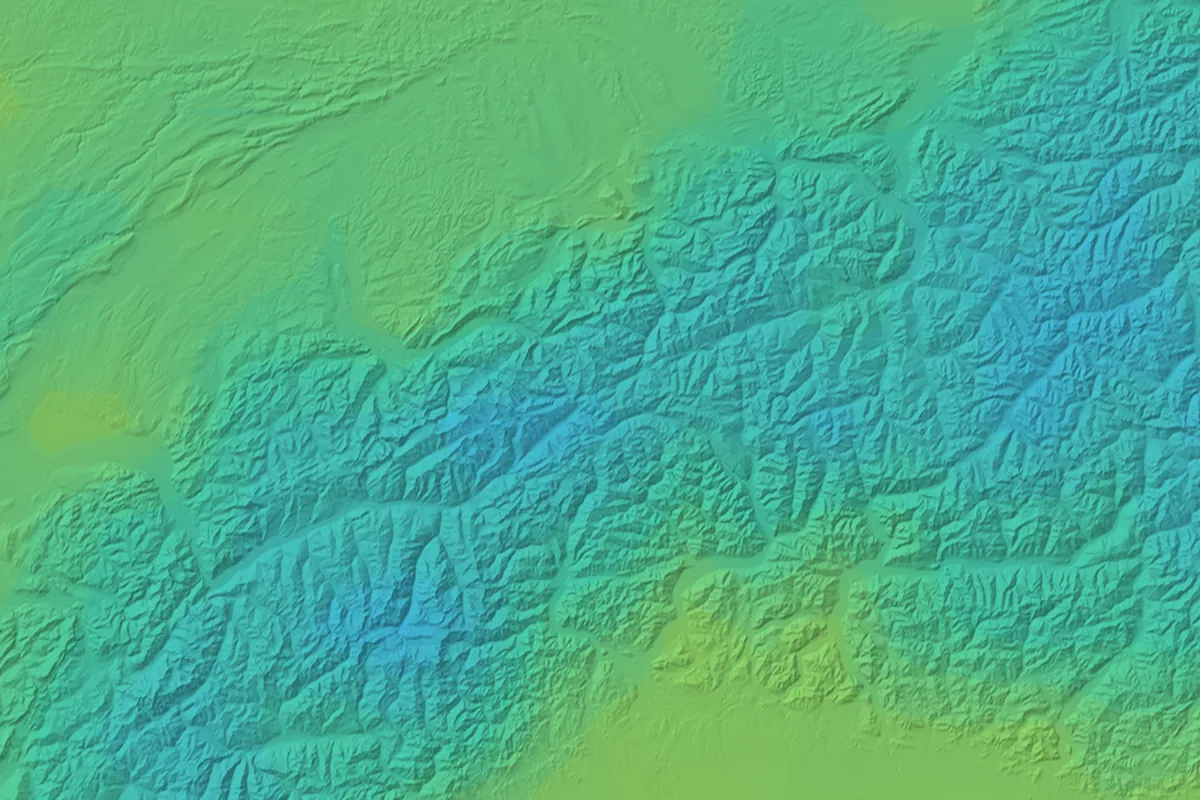
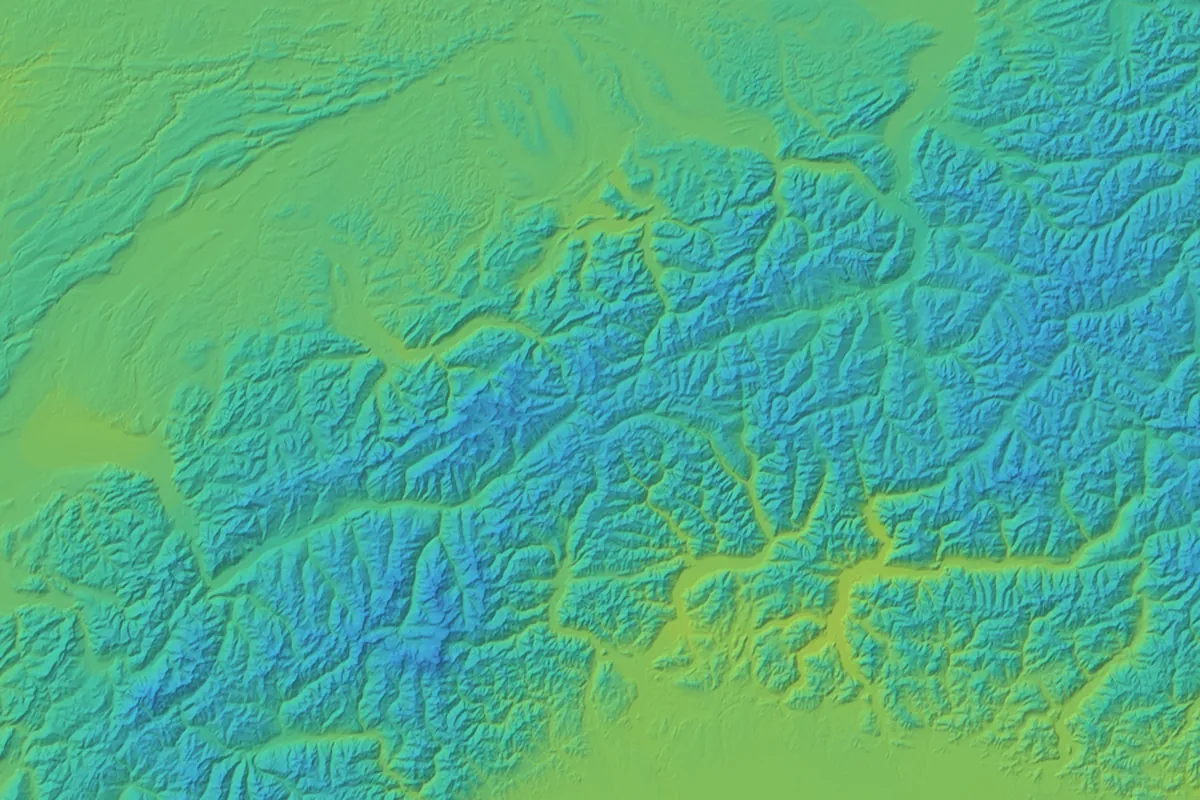
Marble’s temperature layer moves the forecast from the model’s smoothed ground to the real height of the ground under each point you look at, using the model’s own atmosphere. The layer’s legend says so. The result is visible at a glance: valleys appear as warm threads through cold massifs.
Raw model
As Marble shows it
Left: the raw model temperature. Right: the same forecast adjusted to the real ground. ECMWF IFS, 22 November 2026, 06 UTC, western and central Alps, Marble’s colour scale with relief shading.
A line across the Alps
We drew a 172 km line from central Switzerland over the Jungfrau massif and the Rhône valley to Monte Rosa, and compared the forecast with 15 MeteoSwiss stations within 12 km of it. The typical error fell from 3.05 °C to 1.61 °C. Valley stations such as Interlaken and Visp moved from 3–5 °C too cold to within 1.5 °C. The three summit stations, Jungfraujoch, Eggishorn and Gornergrat, went the other way: they ended 2.2–3.7 °C too cold.
A 172 km line across the Alps
The real ground, the model’s smoothed ground and the temperature along the line. Dots are station reports.Chart in words
Top: real ground and the model’s smoothed ground from central Switzerland over the Jungfrau and the Rhône valley to Monte Rosa, with 15 MeteoSwiss stations. Bottom: raw model temperature, the temperature as Marble shows it and the station reports. Typical error 3.05 °C raw, 1.61 °C as shown; valley stations improve, the three summit stations end 2.2–3.7 °C too cold.
The station test
Across 8,932 stations worldwide (IFS runs of 17–22 November 2026, the first 24 hours of each forecast, plus one snapshot of Marble’s own station layer) we made 63,089 comparisons and grouped them by how far each station sits below or above the model’s ground.
Temperature error by station height relative to the model ground
Typical temperature error by station height relative to the model’s ground; the small numbers are comparisons per group. The adjustment helps strongly below the model’s ground, does nothing on flat ground, and over-corrects above it.Chart in words
Typical error (root-mean-square, °C) without and with the height adjustment, for stations below the model ground (valleys) to stations above it (summits). 63,089 comparisons at 8,932 stations, 17–22 November 2026. It improves every group except stations 400–750 m above the model ground, where it gets worse (3.28 to 3.63 °C).
The pattern is clear. Below the model’s ground, in valleys and basins, the error drops sharply: from 6.5 °C to 3.0 °C for stations more than 750 m below it. On flat ground, where 73 % of the comparisons sit, nothing changes (1.75 against 1.73 °C). Above the model’s ground the adjustment overshoots: stations 400–750 m above it ended worse than without any adjustment (3.63 against 3.28 °C).
Day and night, valleys, summits and flat ground
Day and night. Summits at night are the clear failure; valleys still keep about 2.7 °C of typical error at night, when cold air pools in them.Chart in words
Typical error in °C without the adjustment and as Marble shows it. Valleys: night 3.86 to 2.70, day 3.45 to 2.04. Summits: night 4.04 to 3.99 (no real gain), day 4.89 to 2.21. Flat ground: night 1.91 to 1.90, day 1.51 to 1.47.
The improvement held in every region we looked at, most in the Alps (3.09 to 2.17 °C) and Japan (2.42 to 1.65 °C), and at every lead time out to five days.
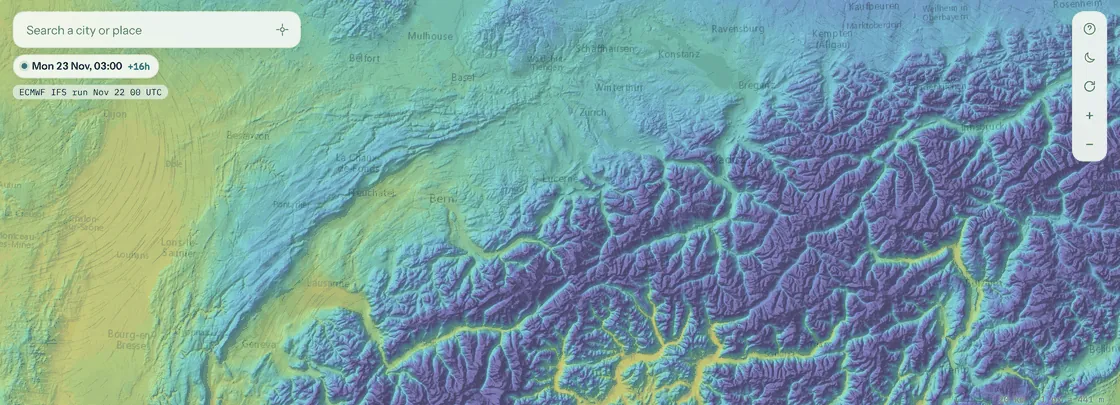
What you see in Marble: the temperature layer over the Alps at night, 23 November 2026, 03:00 UTC (IFS). Real screenshot.
Data and attribution
Forecast data: ECMWF open data (IFS), CC BY 4.0. Terrain: AWS Terrain Tiles. Observations: airport reports via the Iowa Environmental Mesonet, national weather services including MeteoSwiss, GeoSphere Austria and JMA.
A summary of internal testing. Methods are described only in outline. Not an official forecast or warning.

 Raw model
 As Marble shows it