
Note 06 · Limits
What Marble cannot do yet
Marble shows the world’s openly published global forecasts faithfully; it does not replace a local forecaster, an official warning or a high-resolution regional model.
A summary of internal testing. Methods are described only in outline. Not an official forecast or warning.
- 28 kmgrid spacing of the global models (0.25°)valleys, coasts and single storms are not resolved
- ≈ 1 weeklength of most of our verification sampleslate autumn 2026
- 0.52–0.56skill of the station quality grade at spotting bad reports (0.5 = chance)229 stations, 72 hours
- 0push alerts and native apps todaywebsite, installable from the browser
Why we publish this
Transparency is part of the product. The other notes show what we measured and how well Marble did. This one collects what it does not do, or does not do well yet, so you can decide when to rely on it.
Global models, not local ones
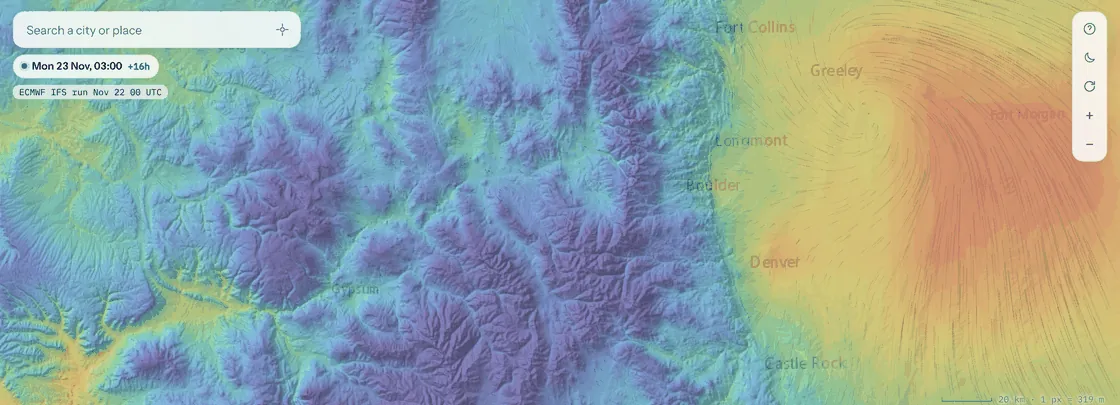
Every forecast field in Marble comes from ECMWF’s open global models at 0.25°, about 28 km between grid points. Valleys, coastlines, single thunderstorms and city heat are smaller than that and are not resolved; the terrain adjustment for temperature helps in valleys but not everywhere (see Temperature where you actually stand). Marble does not show high-resolution regional models. Steps are three-hourly up to six days and six-hourly after that (six-hourly throughout for the AIFS).
Guidance layers are experimental
The spray window, drone flyability, fire spread, frost and flood or landslide layers follow published guidance, but they are hints, not verified forecasts. We checked two drone rules against airport reports: about three in four “marginal” or “no-fly” gust flags were not matched by an observed gust of that size (the layer errs on the cautious side), and the fog hint caught only about one fog report in five. The others have not been verified against observed events.
Radar coverage and rain chance
Native radar data comes from NOAA and covers the contiguous United States. Elsewhere the layer uses RainViewer imagery, whose intensities are approximate and which we could check only once. The nowcast cannot create new storms (see Rain in the next two hours). The rain-chance layer is experimental and not yet calibrated; for light rain it is too confident (see Will it rain in the next hour?).
Short test periods
Our verification covers hours to about one week, mostly in November 2026, one season. Results will differ by weather regime, region and season, and they have not been independently reviewed. Treat every number in these notes as valid for the dates and samples given, not beyond them.
How many days of weather each result rests on
Chart in words
Days covered by each test: radar nowcast 15 days spread from January to November 2026; model comparison 7 days; forecast and terrain tests 5 days of model runs; station reports 3 days; rain chance about one and a half days against satellite and against radar.
Station quality grades are not proven
Marble shows about 9,000 official weather stations, each with a quality grade. The reports themselves agree well with the model and with each other: over 72 hours at 229 stations (about 51,000 reports) the average difference from the model was 1.45 °C for temperature, and neighbouring stations of different networks agreed to a few tenths of a degree. But the grade did not prove able to pick out bad reports: its score was 0.52–0.56 where 0.5 means chance. It needs a redesign, and we say so.
No alerts, no native apps
Marble is a website that can be installed from the browser. It has no push notifications and no App Store or Play Store apps. It is not an official warning service: for warnings, follow your national weather service. It needs a reasonably modern phone or computer, and we have not yet measured its speed on a representative set of phones.
Data and attribution
Forecast data: ECMWF open data, CC BY 4.0. Radar: NOAA MRMS, RainViewer. Observations: national weather services and airport reports.
A summary of internal testing. Methods are described only in outline. Not an official forecast or warning.